Team-specific roster data, position groups, athlete cards, and individual performance summaries that coaches can pull up fast.
Team Dashboard Systems
Team Dashboards for Coaching Staffs
NextGen Sports Science now builds custom web-based performance dashboards that turn roster, force plate, VBT, GPS, and readiness data into clear coaching decisions. This is the upgraded dashboard and analytics system designed for staff rooms, weight rooms, and game-week decisions.
ReadinessGreen / yellow / red decisions coaches can use immediately
VBTVelocity, power, load, and training intent in one view
ReportsPrintable athlete profiles for staff communication
WEB DASHBOARD PLATFORM|LIVE SHEET WORKFLOW
Dashboard Development
A Complete Dashboard System
The NextGen dashboard model follows the way coaches actually work: quick filters, clean athlete snapshots, readiness flags, position rankings, trend views, and print-ready reports. Power BI still matters, but this web platform makes the system easier to deploy, easier to brand, and easier to sell.
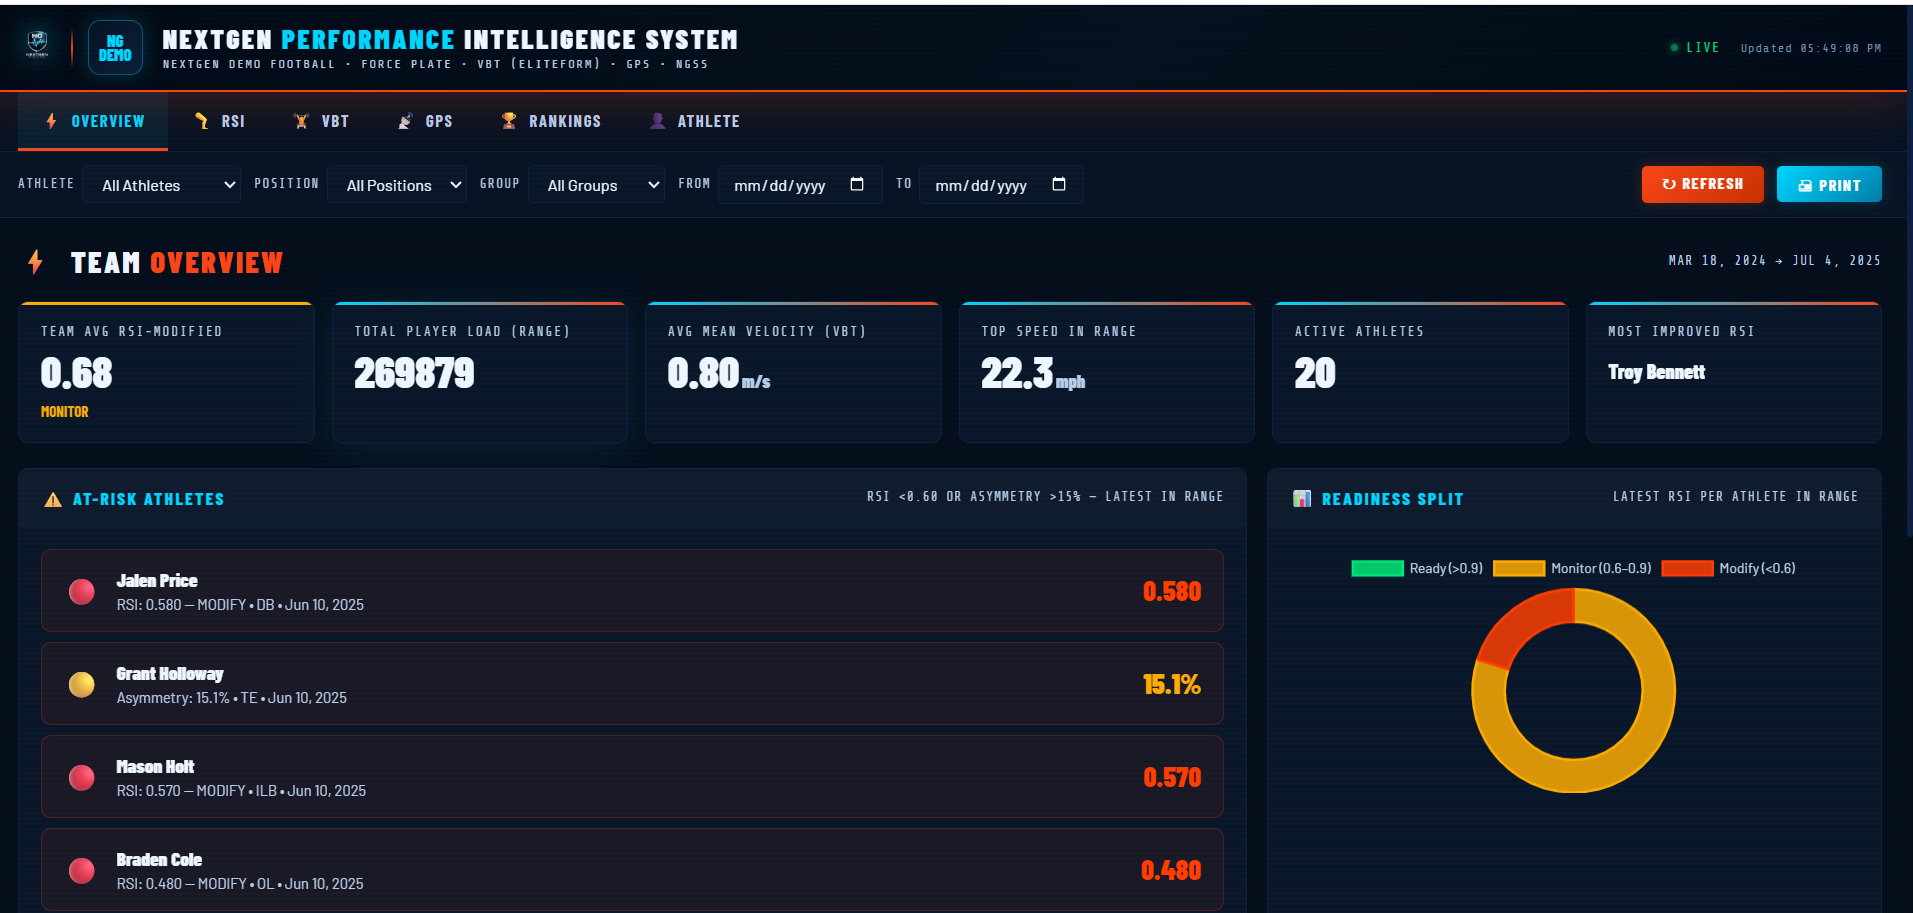
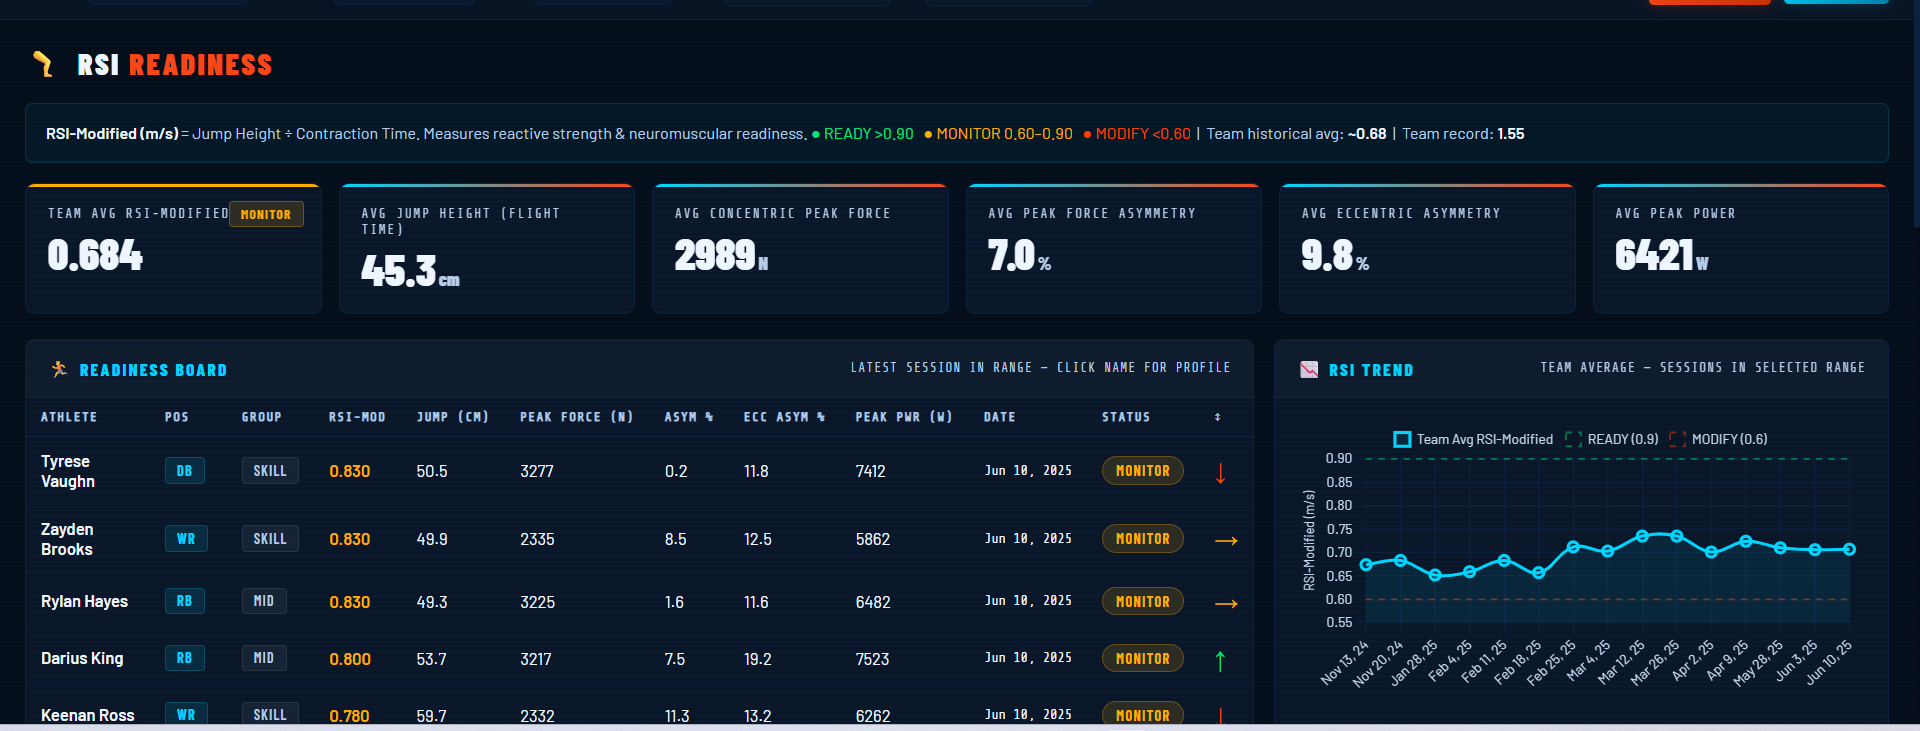
Green, yellow, and red status logic using RSI, jump trends, asymmetry flags, and performance movement versus baseline.
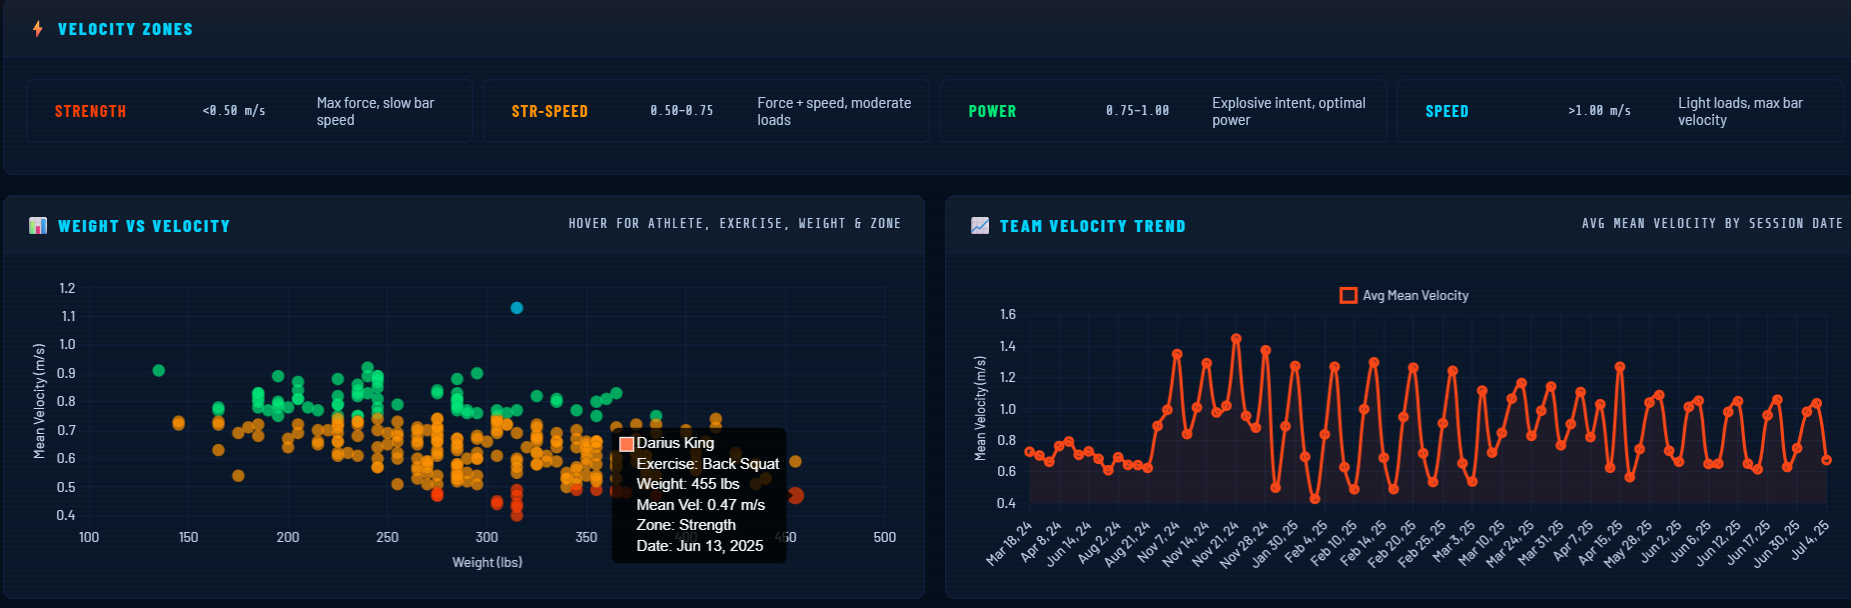
Velocity-based training views for bar speed, peak velocity, mean velocity, power output, and load relationships.
Field load, top speed, acceleration, high-speed efforts, and workload summaries designed for team and position-group decisions.
Platform Screens
Customized for Your Coaching Staff
These screens come from the updated NextGen dashboard platform model. They replace the older analytics showcase with the current web-dashboard workflow.
Team Overview
Readiness Dashboard
VBT Trends
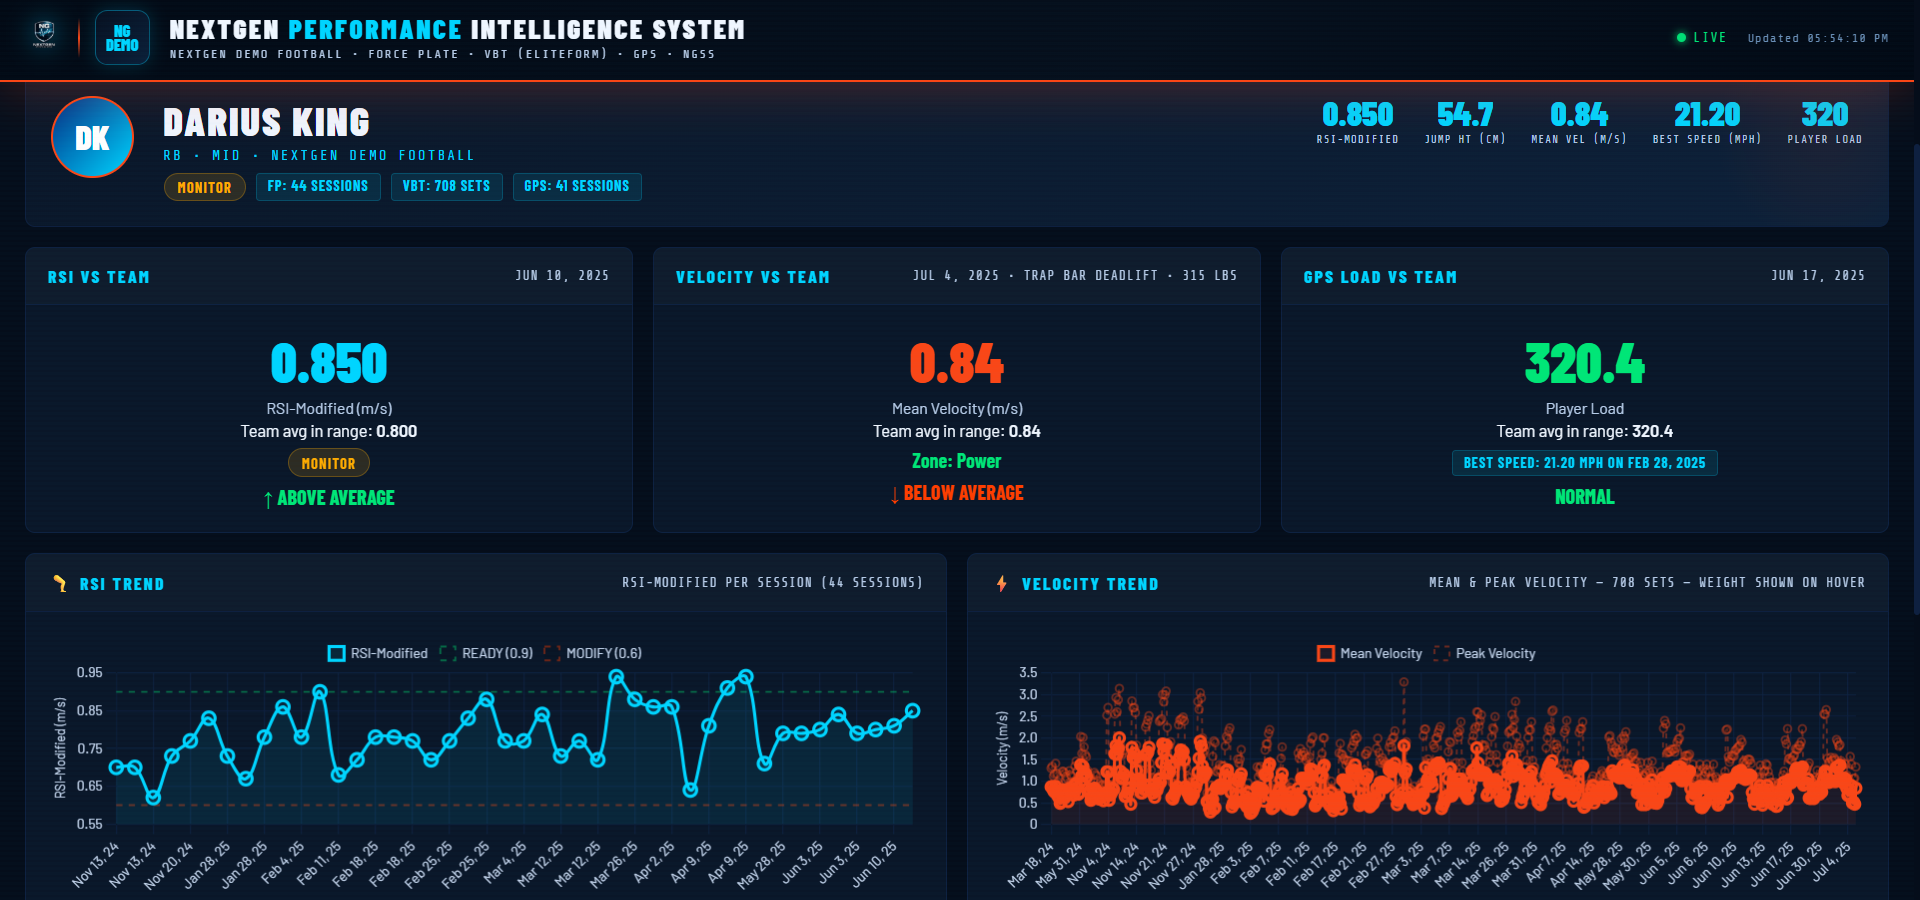
Athlete Snapshot
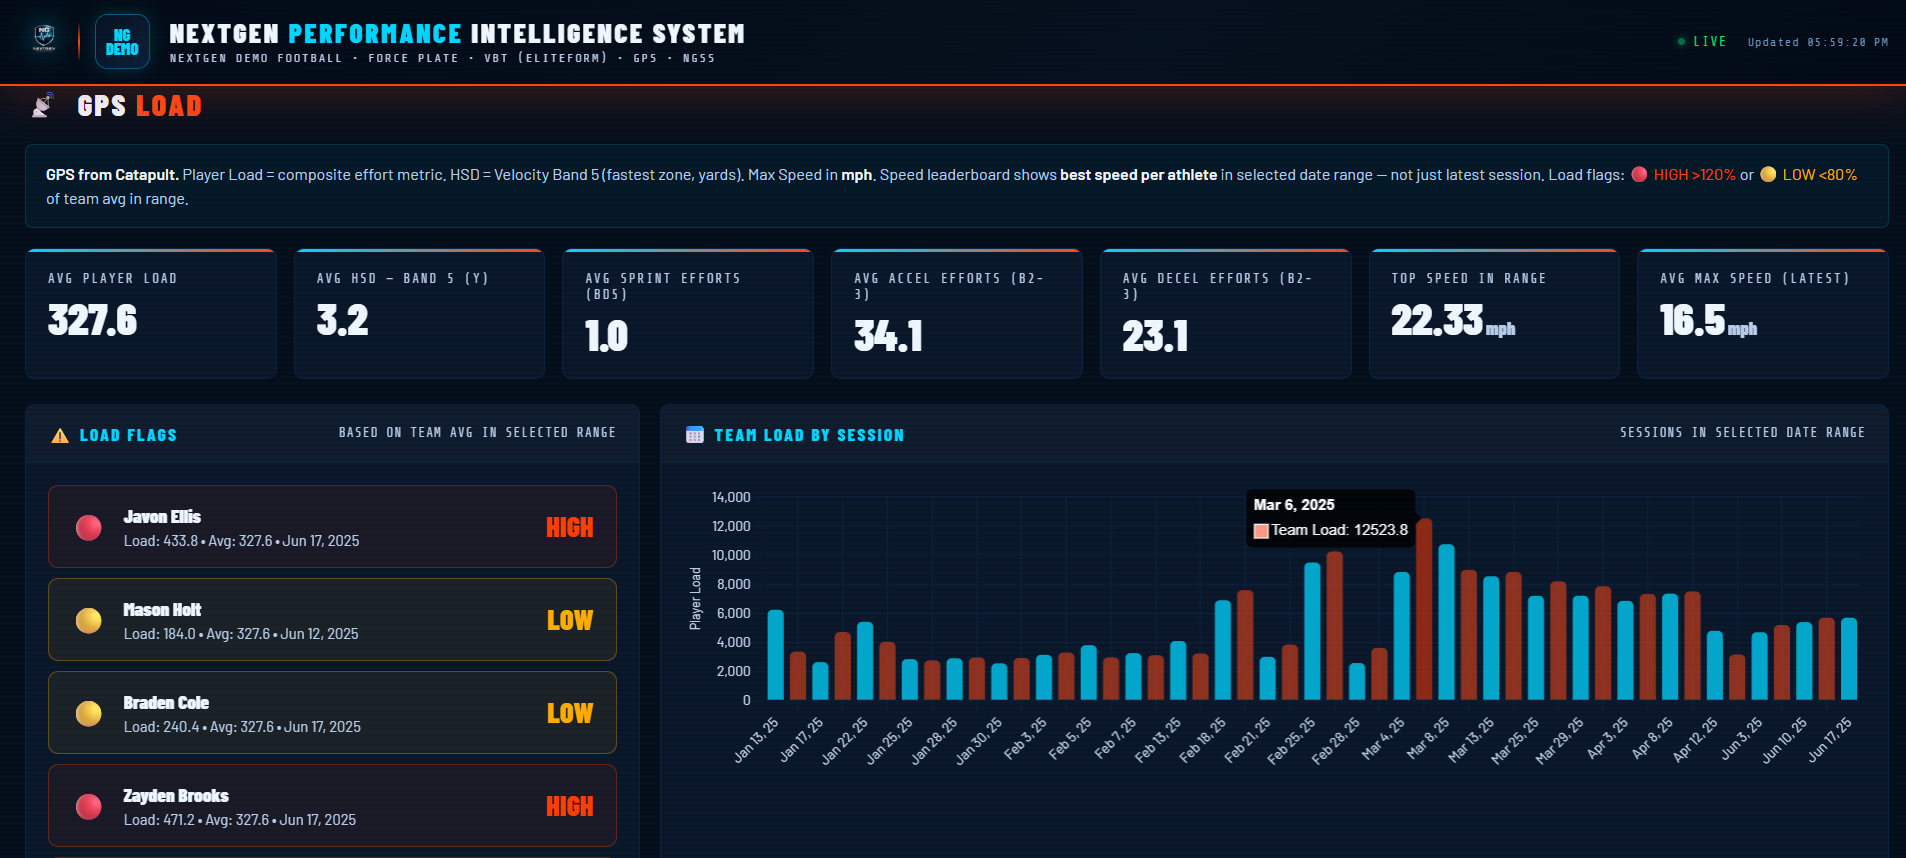
GPS / Load
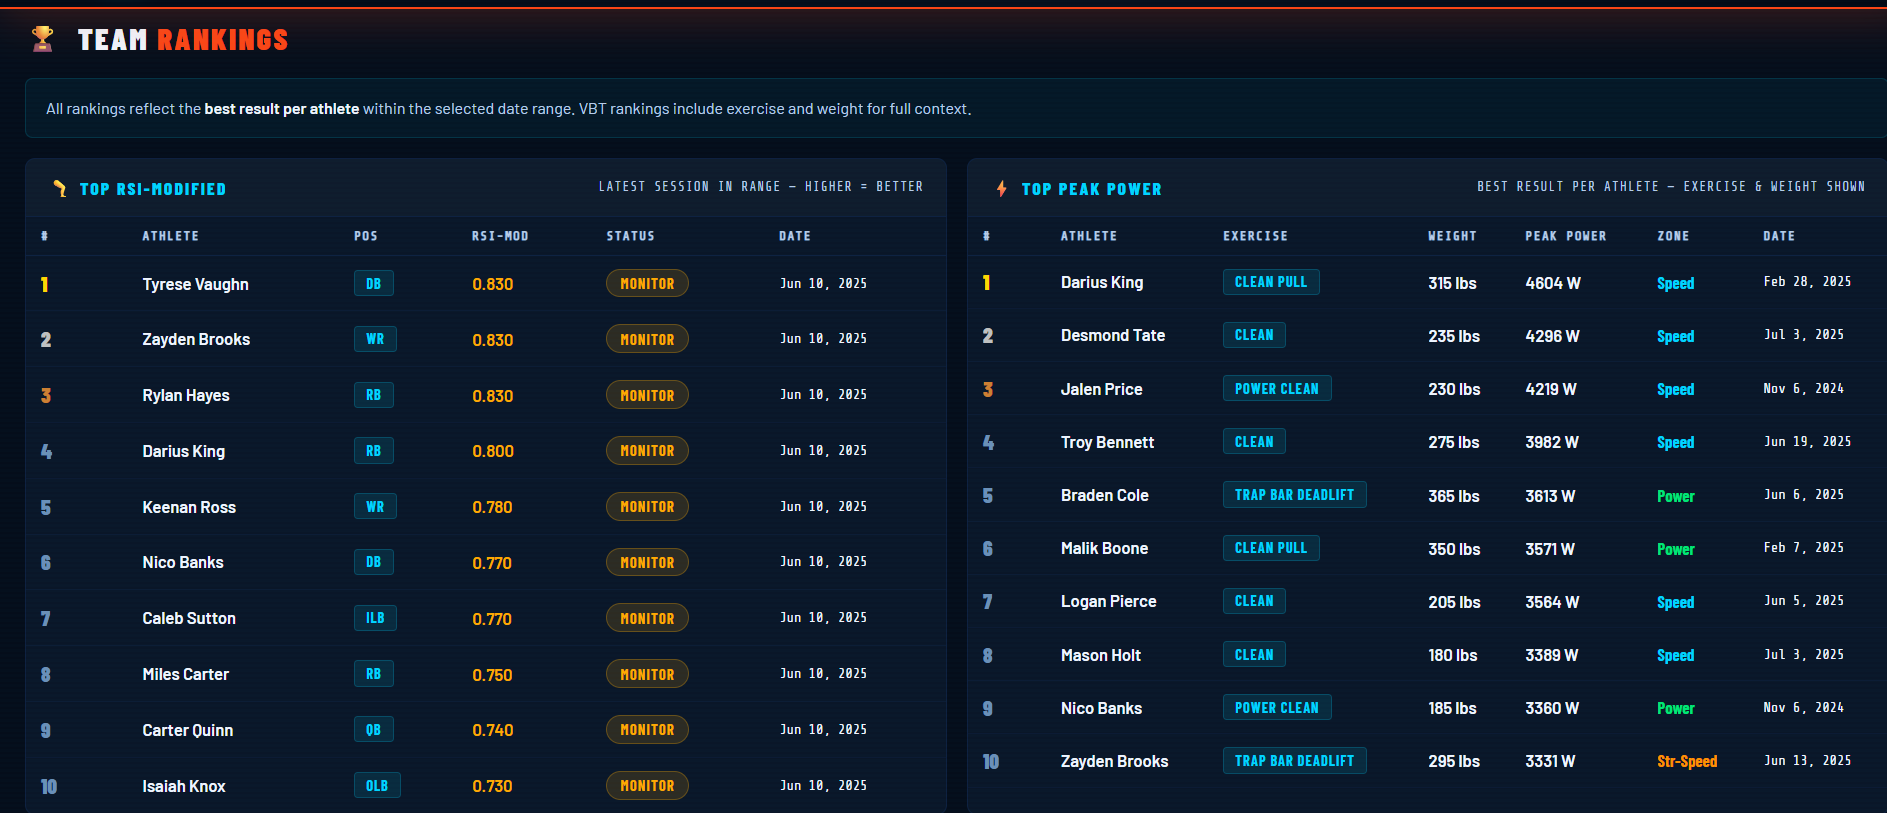
Rankings
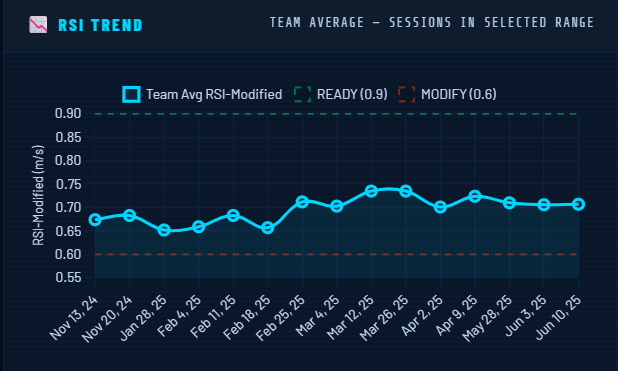
How It Works
From Coach Intake to Live Dashboard
The updated system takes a coach's answers, team branding, roster, and performance data, then turns it into a branded web dashboard connected to the team workflow.
Coach submits team info, colors, logo, and Google Sheet data link
Dashboard adapts to the sport, roster, position groups, and available metrics
Readiness, VBT, GPS, rankings, athlete snapshots, and trends are organized for staff use
Printable reports carry the team branding and make athlete communication easier
The final site is packaged for Netlify deployment and future updates
Coach-Facing Logic
Easy to Understand Data
The dashboard is designed so a coach does not need to be a data analyst to use it. It explains readiness status, flags asymmetry, ranks position groups, and shows athlete trends without burying the staff in spreadsheets.
Green / Yellow / Red Readiness
Asymmetry Flags
Position Rankings
Top Performers
Athlete Trends
Print Profiles
Force Plate / Jump
VBT Velocity + Power
GPS Load
Google Sheets Workflow
Part of the Performance Platform
These Dashboards Live Inside the Platform
This is the same Sports Science module built into the full NextGen Performance Platform — readiness, VBT, GPS, and testing trends alongside training, communication, and recruiting.
Dashboard Platform
A Branded System for Your Team
Use the dashboard development site to start a team-specific build with custom branding, roster data, performance modules, and printable coach reports.